Blog
23 Apr 2023 : How lightly did I tread in 2022 #
It's reassuring to see how seriously global heating is being taken nowadays. There's been a notable shift from individuals being the sole drivers of change, to organisations and governments taking more of a lead. For my own part, I've been trying to keep track of my environmental impact for a number of years now, including offsetting my carbon footprint. Many will rightly say that it's more important to reduce carbon emissions than offset them, and I agree with that, but as long as it doesn't lead to complacency in achieving the former, I'm certain there's still value in doing the latter.
With that in mind, I've spent the last couple of weekends calculating my carbon footprint for 2022. The act of doing this has in itself been a useful exercise, helping highlight where I've been succeeding, and where I've been failing. But the final objective is to allow me to offset my carbon output, which as last year, I've done by contributing to the Ripple Africa initiative providing lower carbon cooking stoves in Malawi.
Here are the results for 2022, with comparison to earlier years and compiled once again using Carbon Footprint Ltd's carbon calculator. These results are for both Joanna and me, so I consider them to be outputs equivalent to a two-person household (even though we were actually living in different places throughout 2022).
The first thing to note is that there's been abig increase compared to my carbon output in 2021 and 2022. The main contributor to this has been carbon emissions due to flying, and the factor with the biggest impact on this has been the pandemic. For all of the years shown here I was living in Tampere, Finland while Joanna was living in Cambridge, UK. Travelling between the two by train (and boat) takes a full four days, compared to a day's travel by plane (and car/train). During the pandemic our ability to travel was naturally curtailed. It's worth looking into the associated numbers here in more detail.
I moved back to the UK at the start of 2023 and now that Joanna and I are living together again, I'd expect our plane travel to reduce to just a handful of trips a year (our aim has to be zero).
My flat in Tampere was incredibly well insulated, but nevertheless still required heating and lighting. Now that I'm back in the UK and no longer renting a flat in Tampere, our overall heating requirements should reduce in 2023. It's also worth noting that our natural gas usage decreased in 2022, while our electricity usage increased. This will be due to the fact we installed a heat pump in February of 2022, so that our heating is now fully renewable rather than gas. For 2023 the balance should shift further.
Our car usage increased again back to something closer to pre-pandemic levels. This is due to Joanna travelling to work again (I had no access to a car in Finland). Our International Rail travel also increased due to two factors: partly because I'm now including all long-distance rail under the category, and partly because we travelled by Eurostar on a couple of occasions.
From the numbers it's clear Joanna and I travelled our longest distances by plane, but the numbers also highlight another important consideration. Each kilometre travelled by plane resulted in 148 g of CO2 (this includes a radiative forcing factor of 1.891), compared to 119 g for car travel and 75 g for bus travel. But according to these numbers train travel generated only 5 g of CO2 per kilometre. That's a huge differential.
Looking at the overall emissions compared to last year I was initially dispirited, but after more careful consideration I'm actually quite encouraged. Joanna and I reduced our carbon output considerably since 2019, which is a fairer point of comparison given the effects of the pandemic in 2020 and 2021. Our move from gas to heat-pump heating is shown positively in the numbers and will have an even bigger impact in 2023 when it covers the whole year. With me moving back to the UK we will be servicing only one household rather than two, and our reliance on flying will decrease, addressing the single largest contributor to our carbon footprint.
For comparison the average carbon footprint in the European Union is 6.8 tonnes, while world wide it's 4.79 tonnes. Split between Joanna and me, our individual footprints average out at 5.825 tonnes. That's clearly too high, but hopefully things are looking more promising for 2023.
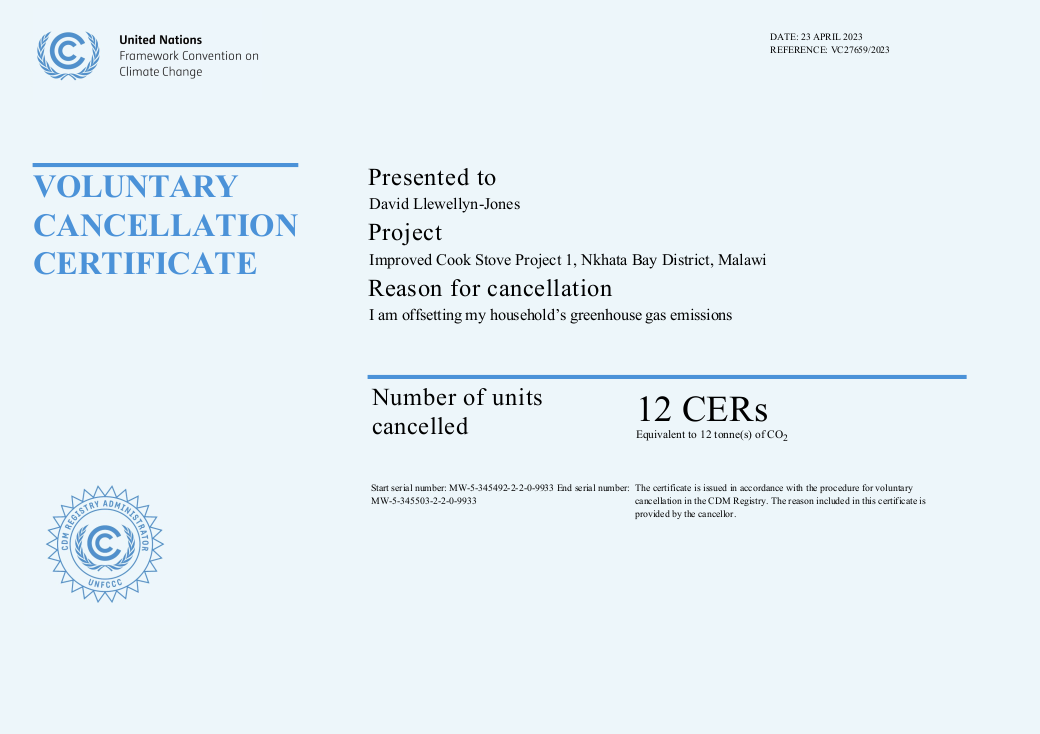
In the meantime, I've once again used the UN Framework Convention on Climate Change to offset our emissions for 2022.
With that in mind, I've spent the last couple of weekends calculating my carbon footprint for 2022. The act of doing this has in itself been a useful exercise, helping highlight where I've been succeeding, and where I've been failing. But the final objective is to allow me to offset my carbon output, which as last year, I've done by contributing to the Ripple Africa initiative providing lower carbon cooking stoves in Malawi.
Here are the results for 2022, with comparison to earlier years and compiled once again using Carbon Footprint Ltd's carbon calculator. These results are for both Joanna and me, so I consider them to be outputs equivalent to a two-person household (even though we were actually living in different places throughout 2022).
| Source | CO2 output 2019 (t) | CO2 output 2020 (t) | CO2 output 2021 (t) | CO2 output 2022 (t) |
|---|---|---|---|---|
| Electricity | 0.50 | 0.40 | 0.59 | 1.14 |
| Natural gas | 1.18 | 1.26 | 1.66 | 0.81 |
| Flights | 5.76 | 2.26 | 1.90 | 5.34 |
| Car | 1.45 | 0.39 | 0.39 | 1.01 |
| Bus | 0.00 | 0.01 | 0.02 | 0.01 |
| National rail | 0.08 | 0.01 | 0.02 | 0.00 |
| International rail | 0.02 | 0.01 | 0.00 | 0.04 |
| Taxi | 0.01 | 0.01 | 0.01 | 0.01 |
| Food and drink | 1.69 | 1.11 | 1.05 | 1.35 |
| Pharmaceuticals | 0.26 | 0.32 | 0.31 | 0.06 |
| Clothing | 0.03 | 0.06 | 0.06 | 0.12 |
| Paper-based products | 0.34 | 0.15 | 0.14 | 0.37 |
| Computer usage | 1.30 | 1.48 | 0.75 | 0.93 |
| Electrical | 0.12 | 0.29 | 0.19 | 0.03 |
| Non-fuel car | 0.00 | 0.10 | 0.00 | 0.12 |
| Manufactured goods | 0.50 | 0.03 | 0.03 | 0.05 |
| Hotels, restaurants | 0.51 | 0.16 | 0.15 | 0.10 |
| Telecoms | 0.15 | 0.05 | 0.04 | 0.03 |
| Finance | 0.24 | 0.24 | 0.22 | 0.04 |
| Insurance | 0.19 | 0.11 | 0.10 | 0.04 |
| Education | 0.05 | 0.00 | 0.04 | 0.01 |
| Recreation | 0.09 | 0.06 | 0.05 | 0.03 |
| Total | 14.47 | 8.50 | 7.73 | 11.65 |
The first thing to note is that there's been abig increase compared to my carbon output in 2021 and 2022. The main contributor to this has been carbon emissions due to flying, and the factor with the biggest impact on this has been the pandemic. For all of the years shown here I was living in Tampere, Finland while Joanna was living in Cambridge, UK. Travelling between the two by train (and boat) takes a full four days, compared to a day's travel by plane (and car/train). During the pandemic our ability to travel was naturally curtailed. It's worth looking into the associated numbers here in more detail.
| Source | Details for 2019 | Details for 2020 | Details for 2021 | Details for 2022 |
|---|---|---|---|---|
| Electricity | 1 794 kWh | 1 427 kWh | 3 009 kWh | 4 101 kWh |
| Natural gas | 6 433 kWh | 6 869 kWh | 9 089 kWh | 4 439 kWh |
| Flights | 36 580 km (20 flights) | 14 632 km (8 flights) | 25 542 km (14 flights) | 36 042 km (20 flights) |
| Car | 11 910 km | 2 000 km | 3 219 km | 8 458 km |
| Bus | 1 930 km | 40 km | 168 km | 133 km |
| National rail | 5 630 km | 400 km | 676 km | 0 km |
| International rail | 64 km | 1 368 km | 513 km | 8 684 km |
| Taxi | 64 km | 37 km | 100 km | 100 km |
I moved back to the UK at the start of 2023 and now that Joanna and I are living together again, I'd expect our plane travel to reduce to just a handful of trips a year (our aim has to be zero).
My flat in Tampere was incredibly well insulated, but nevertheless still required heating and lighting. Now that I'm back in the UK and no longer renting a flat in Tampere, our overall heating requirements should reduce in 2023. It's also worth noting that our natural gas usage decreased in 2022, while our electricity usage increased. This will be due to the fact we installed a heat pump in February of 2022, so that our heating is now fully renewable rather than gas. For 2023 the balance should shift further.
Our car usage increased again back to something closer to pre-pandemic levels. This is due to Joanna travelling to work again (I had no access to a car in Finland). Our International Rail travel also increased due to two factors: partly because I'm now including all long-distance rail under the category, and partly because we travelled by Eurostar on a couple of occasions.
From the numbers it's clear Joanna and I travelled our longest distances by plane, but the numbers also highlight another important consideration. Each kilometre travelled by plane resulted in 148 g of CO2 (this includes a radiative forcing factor of 1.891), compared to 119 g for car travel and 75 g for bus travel. But according to these numbers train travel generated only 5 g of CO2 per kilometre. That's a huge differential.
Looking at the overall emissions compared to last year I was initially dispirited, but after more careful consideration I'm actually quite encouraged. Joanna and I reduced our carbon output considerably since 2019, which is a fairer point of comparison given the effects of the pandemic in 2020 and 2021. Our move from gas to heat-pump heating is shown positively in the numbers and will have an even bigger impact in 2023 when it covers the whole year. With me moving back to the UK we will be servicing only one household rather than two, and our reliance on flying will decrease, addressing the single largest contributor to our carbon footprint.
For comparison the average carbon footprint in the European Union is 6.8 tonnes, while world wide it's 4.79 tonnes. Split between Joanna and me, our individual footprints average out at 5.825 tonnes. That's clearly too high, but hopefully things are looking more promising for 2023.
In the meantime, I've once again used the UN Framework Convention on Climate Change to offset our emissions for 2022.
Comments
Uncover Disqus comments