List items
Items from the current list are shown below.
Blog
All items from October 2020
29 Oct 2020 : Dishwasher or washing up bowl. Which is really better for the environment? #
Last week I considered whether I should be buying stuff in plastic packaging in preference to glass. So since I've started this game, I thought it would be good to move on a step and look at another part of my life.
The rented flat where I live comes with a dishwasher, but I've never actually used it. The main reason is that I don't have enough crockery to fill it, but maybe I should? I've been told in discussion, and also by advertisements, that using a dishwasher is more ecological than washing up by hand. This always seemed a bit implausible to me, but maybe it's true?
Let's find out.
First of all, how much energy is needed to do a batch of washing up? This depends on what you do, but my washing up regime is pretty consistent: I fill the sink with water that's as hot as I'm comfortable splooshing around in. I never use more than one sink's-worth since, as I already mentioned, I don't have much crockery anyway.
To work out how much energy it takes for me to wash up we need two things: the amount of water, and the temperature increase of the water.
For the amount I filled the sink using my kettle. It took a total of six kettle-cycles. Each cycle I weighed the kettle before and after and recorded the weight difference. Adding up all of these differences gave me the total weight of water that went into the sink: $10.234\ {\rm kg}$.
The temperature I find comfortable in the sink is $38^{\circ} {\rm C}$, which is a raise of $18^{\circ} {\rm C}$ (or 18 Kelvin) above room temperature.
A quick skim of the Web reveals that the specific heat capacity of water at this temperature is $4179.6\ {\rm J}\ {\rm kg}^{-1}\ {\rm K}^{-1}$.
So, to calculate the energy $E_S$ required (where $S$ stands for sink), we need to multiply everything together like so.
\begin{align}
E_S &= 4179.6\ {\rm J}\ {\rm kg}^{-1}\ {\rm K}^{-1} \times 10.234\ {\rm kg} \times 18\ {\rm K} \\
&= 769932\ {\rm J} \\
&= 770\ {\rm kJ}.
\end{align}
That's the first half of our comparison. Now we need the energy $E_D$ used by the dishwasher (I'll leave you to figure out what the $D$ stands for). The diswasher is an AEG F77420W0P (energy efficiency class A++) and luckily the dishwasher manual has a handy table that lists the energy requirements of the different modes. The table only has the values in kilowatt hours, but this is just a different unit for measurement energy. In fact $1\ {\rm kWh} = 3.6 \times 10^6\ {\rm J}$, so we can calculate the kJ by multiplying the kWh values by 3600.
I don't know what these different modes — ECO, Auto and PRO — are for, but let's assume we'd be using the ECO setting. This means that for my dishwasher, in ECO mode, we have $E_D = 2520\ {\rm kJ}$.
And now we have what we need to do a comparison.
A washing up session takes $770\ {\rm kJ}$ whereas a dishwasher load takes $2520\ {\rm KJ}$; one dishwasher load is the equivalent of 3.27 sinks of washing up. My dishwasher is of the slim variety, but it still holds up to 14 plates, plus a bunch of other stuff. So if I wash at least 5 plates with each sink of water, then the sink will end up being more ecological in the long run. That's not unreasonable and suggests to me that in fact, the sink and dishwasher are fairly similar in terms of their energy use.
However, another factor is the water usage. The manual states that 9.9 litres of water are needed for an ECO load. That's the same amount as a single dish washing session in the sink, so the comparison here is in favour of the dishwasher.
To summarise, it does indeed seem that if you're doing a full load, you'd be better off (environmentally speaking) using the dishwasher. If you're doing less than a full load, the sink could well be better.
None of this includes the energy needed to build the dishwasher. According to this article in The Guardian, for an appiance that lasts 10 years this could add an extra 20% environmental cost, but I've not seen the calcuations and I couldn't find the actual figures for my dishwasher, so I'm not including that here.
These numbers are also all rather specific to my situation of course. A bigger dishwasher might be more efficient. For me, it's a little academic, since it would impossible for me to fill the dishwasher, so the future for me is clear: more washing up.
Comment
The rented flat where I live comes with a dishwasher, but I've never actually used it. The main reason is that I don't have enough crockery to fill it, but maybe I should? I've been told in discussion, and also by advertisements, that using a dishwasher is more ecological than washing up by hand. This always seemed a bit implausible to me, but maybe it's true?
Let's find out.
First of all, how much energy is needed to do a batch of washing up? This depends on what you do, but my washing up regime is pretty consistent: I fill the sink with water that's as hot as I'm comfortable splooshing around in. I never use more than one sink's-worth since, as I already mentioned, I don't have much crockery anyway.
To work out how much energy it takes for me to wash up we need two things: the amount of water, and the temperature increase of the water.
For the amount I filled the sink using my kettle. It took a total of six kettle-cycles. Each cycle I weighed the kettle before and after and recorded the weight difference. Adding up all of these differences gave me the total weight of water that went into the sink: $10.234\ {\rm kg}$.
The temperature I find comfortable in the sink is $38^{\circ} {\rm C}$, which is a raise of $18^{\circ} {\rm C}$ (or 18 Kelvin) above room temperature.
A quick skim of the Web reveals that the specific heat capacity of water at this temperature is $4179.6\ {\rm J}\ {\rm kg}^{-1}\ {\rm K}^{-1}$.
So, to calculate the energy $E_S$ required (where $S$ stands for sink), we need to multiply everything together like so.
\begin{align}
E_S &= 4179.6\ {\rm J}\ {\rm kg}^{-1}\ {\rm K}^{-1} \times 10.234\ {\rm kg} \times 18\ {\rm K} \\
&= 769932\ {\rm J} \\
&= 770\ {\rm kJ}.
\end{align}
That's the first half of our comparison. Now we need the energy $E_D$ used by the dishwasher (I'll leave you to figure out what the $D$ stands for). The diswasher is an AEG F77420W0P (energy efficiency class A++) and luckily the dishwasher manual has a handy table that lists the energy requirements of the different modes. The table only has the values in kilowatt hours, but this is just a different unit for measurement energy. In fact $1\ {\rm kWh} = 3.6 \times 10^6\ {\rm J}$, so we can calculate the kJ by multiplying the kWh values by 3600.
| Mode | Energy (kWh) | Energy (kJ) | Water (l) |
|---|---|---|---|
| ECO | 0.7 | 2520 | 9.9 |
| Auto | 0.5 — 1.2 | 1800 — 4320 | 6.0 — 11.0 |
| PRO | 1.3 — 1.4 | 4680 — 5040 | 11.0 — 13.0 |
I don't know what these different modes — ECO, Auto and PRO — are for, but let's assume we'd be using the ECO setting. This means that for my dishwasher, in ECO mode, we have $E_D = 2520\ {\rm kJ}$.
And now we have what we need to do a comparison.
A washing up session takes $770\ {\rm kJ}$ whereas a dishwasher load takes $2520\ {\rm KJ}$; one dishwasher load is the equivalent of 3.27 sinks of washing up. My dishwasher is of the slim variety, but it still holds up to 14 plates, plus a bunch of other stuff. So if I wash at least 5 plates with each sink of water, then the sink will end up being more ecological in the long run. That's not unreasonable and suggests to me that in fact, the sink and dishwasher are fairly similar in terms of their energy use.
However, another factor is the water usage. The manual states that 9.9 litres of water are needed for an ECO load. That's the same amount as a single dish washing session in the sink, so the comparison here is in favour of the dishwasher.
To summarise, it does indeed seem that if you're doing a full load, you'd be better off (environmentally speaking) using the dishwasher. If you're doing less than a full load, the sink could well be better.
None of this includes the energy needed to build the dishwasher. According to this article in The Guardian, for an appiance that lasts 10 years this could add an extra 20% environmental cost, but I've not seen the calcuations and I couldn't find the actual figures for my dishwasher, so I'm not including that here.
These numbers are also all rather specific to my situation of course. A bigger dishwasher might be more efficient. For me, it's a little academic, since it would impossible for me to fill the dishwasher, so the future for me is clear: more washing up.
26 Oct 2020 : Glass or plastic. Which is really better for the environment? #
For the last 14 months I’ve been collecting data about how much rubbish I produce, broken down into various categories (paper, card, glass, metal, returnables, compost, plastic and general). I’ve had two aims: first to gather data about how much rubbish I generate and second to try to reduce my overall output for environmental reasons.
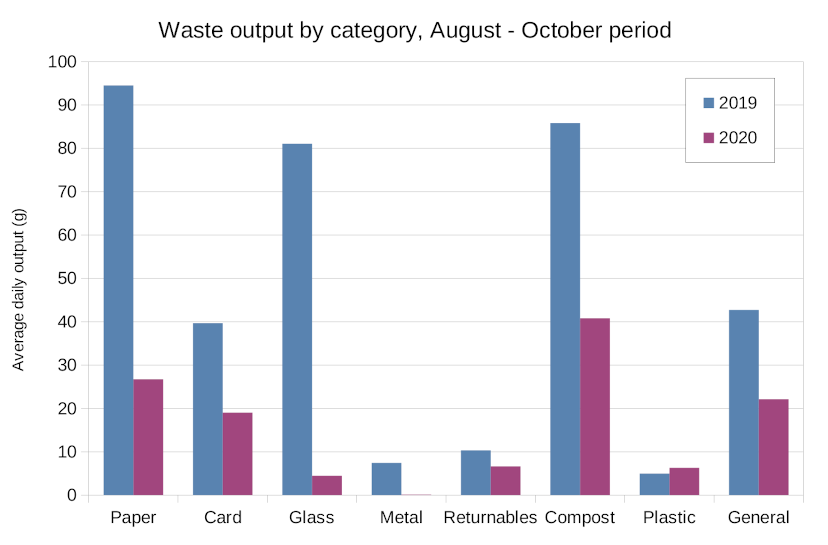
One of the encouraging things about this process is that it seems to have worked. If I look at my waste output between mid-August and mid-October 2020 and compare it to the same period last year, my output has reduced from an average of 366 g per day to 126 g per day, a two thirds decrease. Here’s the breakdown of how the two years compare across the categories.
I’ve been using a variety of different techniques to achieve this. For example my tolerance for eating food past it’s best-before date has increased considerably. There’s a sticker above my letter box asking not to receive any junk mail. I also buy food with lighter packaging: cardboard packets of beans instead of tins, cartons of wine instead of bottles. Wherever possible I buy plastic pots and bottles instead of glass.
Glass is really heavy, so cutting it out has been a really easy way to reduce the weight of my waste and as you can see from the graph, this is where I made my biggest decrease. But for many this choice will seem controversial, and many times when I’ve picked a plastic bottle from the shelf at the grocer instead of glass, I’ve wondered whether I was driven more by hitting my weight targets than any real environmental benefits.
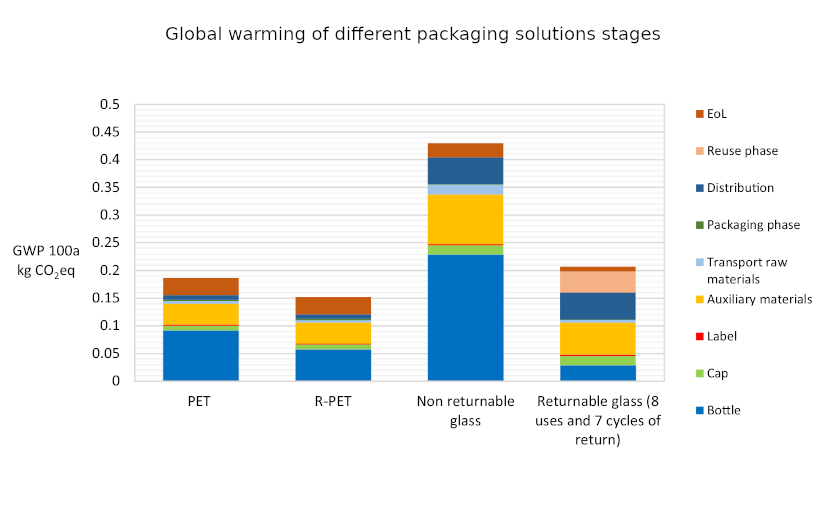
So I thought I’d better look into the relative environmental impacts of glass as compared to plastic. Plastic has had a bad rap recently for having a terrible impact on the marine environment. But this is rather emotive, and is only one facet of the environmental impact of a product. Actually figuring out the full life cycle environmental impact of something is fiendishly difficult. You have to consider the production costs, transportation costs, recycling costs and much more besides. Happily Roberta Stefanini, Giulia Borghesi, Anna Ronzano and Giuseppe Vignali from the University of Parma have done all of this hard work already. Their paper “Plastic or glass: a new environmental assessment with a marine litter indicator for the comparison of pasteurized milk bottle”, recently published in the International Journal of Life Cycle Assessment, compares the environmental impact of glass and plastic polyethylene terephthalate (PET) across a range of environmental factors for the full life cycle of the packaging. This includes comparing non-recycled PET with recycled PET (R-PET) bottles, as well as non-returnable glass and returnable glass bottles.
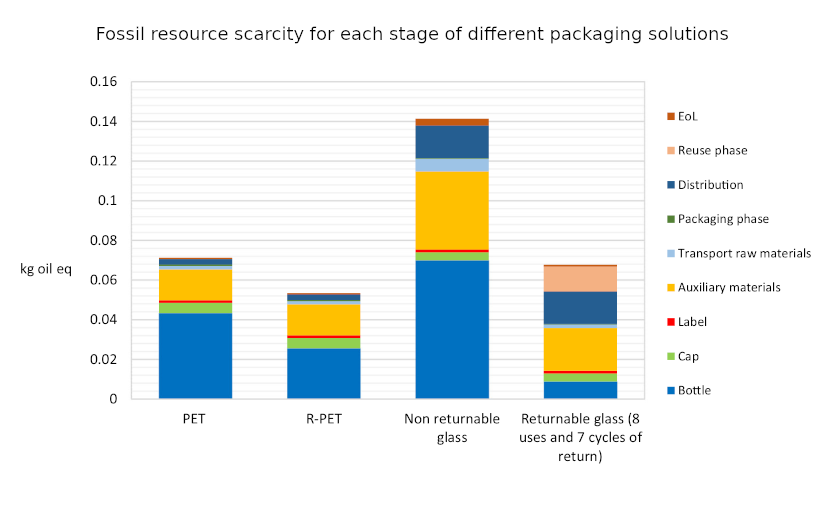
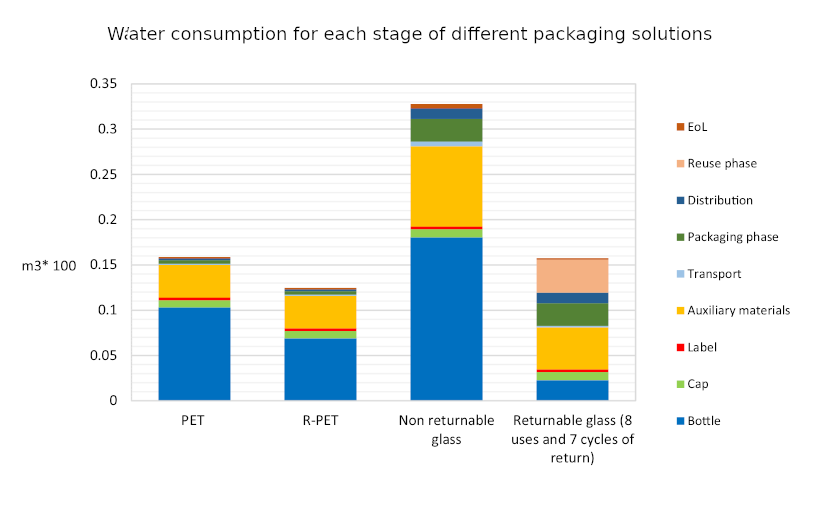
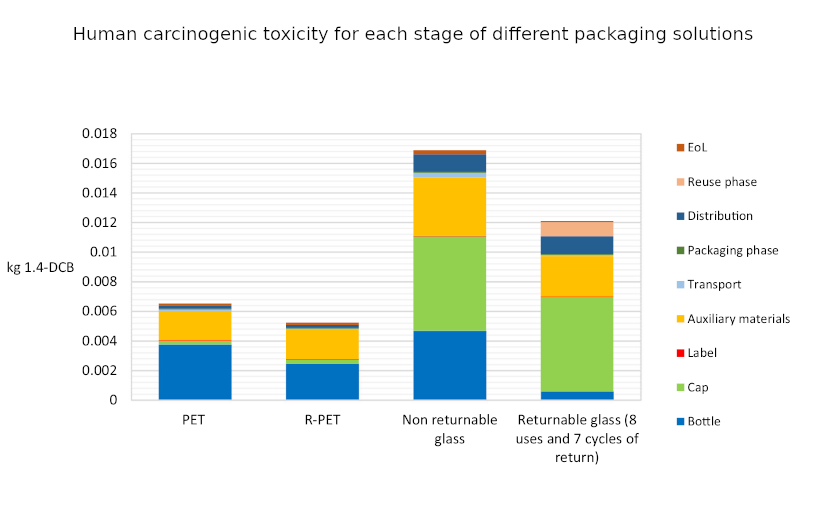
The indicators used for comparison are “global warming (kg CO2 eq), stratospheric ozone depletion (kg CFC11 eq), terrestrial acidification (kg SO2 eq), fossil resource scarcity (kg oil eq), water consumption (m3) and human carcinogenic toxicity (kg 1.4-DCB)”. In addition they also introduce a new marine litter indicator (MLI).
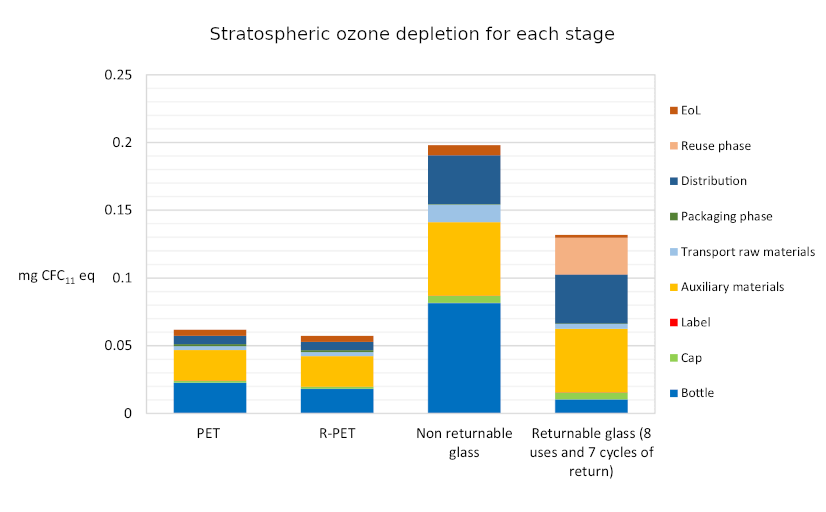
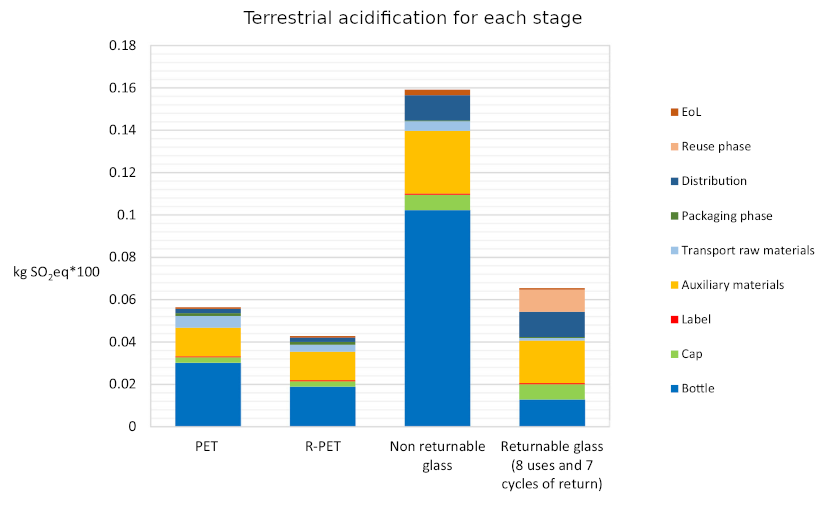
What they find is surprisingly clear-cut. Across all of the indicators apart from MLI the same pattern emerges: R-PET is the least environmentally damaging, followed by PET. Returnable glass bottles follow, with non-returnable glass bottles the worst by a large margin. We can see this in the six graphs below. There’s a lot of detail in them, but I wanted to include them in full because it’s fascinating to see both how complex the results are and also how the different processes contribute to the final environmental cost. But in spite of the detail the overall conclusion from each graph is clear: non returnable glass is worse than the others (in all of the graphs higher is worse).
It’s a surprising definitive set of results. So why is it like this? The authors of the paper put this more clearly and succinctly than I could manage.
It’s worth noting that in the case of returnable glass bottles the authors assume that a bottle is reused eight times before having to be recycled. This is the number of reuses after which a bottle is likely to become broken or too scuffed to be used again. They determine that a bottle would have to be reused thirty times before its global warming potential reaches similar levels to those of a PET bottle, at which point the other criteria would still be worse environmentally.
The remaining criterion, not shown in these graphs, is that of the MLI. Here things change. MLI is proposed in the paper as an approach to comparing the relative impact on the marine ecosystem of the different packaging types. MLI is defined as follows:
$$
{\rm MLI} = \frac{F_1^{f_1} \times F_4^{f_4}}{F_2^{f_2} \times F_3^{f_3}}
$$
where $F_1$ is the number of disbursed containers, $F_2$ is the incentive for returning a bottle (e.g. the cash given for returning it), $F_3$ is the weight of the packaging material and $F_4$ is the material degradation over time (400 years in the case of glass, 100 years for PET). The values $f_1, \ldots, f_4$ are weights used to capture the relative importance of each of the four inputs.
The results for various weightings are given in this table (taken from the paper but amended slightly for clarity). As with the graphs, a higher number is environmentally worse.
This table shows that independent of the weights applied, non-returnable glass has the highest environmental impact. However, the comparison between R-PET and returnable glass is more nuanced. The authors conclude the following:
The paper is thorough and we’ve covered a lot of detail here, but the conclusion for me is much simpler: from an environmental perspective returnable PET plastic is clearly better than glass across multiple criteria. The only place where this doesn’t apply is for MLI, for which it’s much harder to make definitive judgements.
It seems therefore, that I should carry on choosing plastic packaging over glass whenever possible. That will benefit both my weight targets and the environment.
Comment
One of the encouraging things about this process is that it seems to have worked. If I look at my waste output between mid-August and mid-October 2020 and compare it to the same period last year, my output has reduced from an average of 366 g per day to 126 g per day, a two thirds decrease. Here’s the breakdown of how the two years compare across the categories.
I’ve been using a variety of different techniques to achieve this. For example my tolerance for eating food past it’s best-before date has increased considerably. There’s a sticker above my letter box asking not to receive any junk mail. I also buy food with lighter packaging: cardboard packets of beans instead of tins, cartons of wine instead of bottles. Wherever possible I buy plastic pots and bottles instead of glass.
Glass is really heavy, so cutting it out has been a really easy way to reduce the weight of my waste and as you can see from the graph, this is where I made my biggest decrease. But for many this choice will seem controversial, and many times when I’ve picked a plastic bottle from the shelf at the grocer instead of glass, I’ve wondered whether I was driven more by hitting my weight targets than any real environmental benefits.
So I thought I’d better look into the relative environmental impacts of glass as compared to plastic. Plastic has had a bad rap recently for having a terrible impact on the marine environment. But this is rather emotive, and is only one facet of the environmental impact of a product. Actually figuring out the full life cycle environmental impact of something is fiendishly difficult. You have to consider the production costs, transportation costs, recycling costs and much more besides. Happily Roberta Stefanini, Giulia Borghesi, Anna Ronzano and Giuseppe Vignali from the University of Parma have done all of this hard work already. Their paper “Plastic or glass: a new environmental assessment with a marine litter indicator for the comparison of pasteurized milk bottle”, recently published in the International Journal of Life Cycle Assessment, compares the environmental impact of glass and plastic polyethylene terephthalate (PET) across a range of environmental factors for the full life cycle of the packaging. This includes comparing non-recycled PET with recycled PET (R-PET) bottles, as well as non-returnable glass and returnable glass bottles.
The indicators used for comparison are “global warming (kg CO2 eq), stratospheric ozone depletion (kg CFC11 eq), terrestrial acidification (kg SO2 eq), fossil resource scarcity (kg oil eq), water consumption (m3) and human carcinogenic toxicity (kg 1.4-DCB)”. In addition they also introduce a new marine litter indicator (MLI).
What they find is surprisingly clear-cut. Across all of the indicators apart from MLI the same pattern emerges: R-PET is the least environmentally damaging, followed by PET. Returnable glass bottles follow, with non-returnable glass bottles the worst by a large margin. We can see this in the six graphs below. There’s a lot of detail in them, but I wanted to include them in full because it’s fascinating to see both how complex the results are and also how the different processes contribute to the final environmental cost. But in spite of the detail the overall conclusion from each graph is clear: non returnable glass is worse than the others (in all of the graphs higher is worse).
It’s a surprising definitive set of results. So why is it like this? The authors of the paper put this more clearly and succinctly than I could manage.
"glass bottles have the highest impact on environment, because of their production and transports. In fact, to create a glass bottle a lot of energy is used to reach high temperature. Moreover, plastics can be transported in octabins before the bottle formation in the food companies, while glass bottles are already transported in their final form, that takes up a lot of places and less bottles can be carried at each journey. Finally, glass bottle’s weight is very high, and trucks consume more, emitting more pollutants. For these reasons, glass bottle appears as the most impactful material according to global warming, stratospheric ozone depletion, terrestrial acidification, fossil resource scarcity and water consumption."
It’s worth noting that in the case of returnable glass bottles the authors assume that a bottle is reused eight times before having to be recycled. This is the number of reuses after which a bottle is likely to become broken or too scuffed to be used again. They determine that a bottle would have to be reused thirty times before its global warming potential reaches similar levels to those of a PET bottle, at which point the other criteria would still be worse environmentally.
The remaining criterion, not shown in these graphs, is that of the MLI. Here things change. MLI is proposed in the paper as an approach to comparing the relative impact on the marine ecosystem of the different packaging types. MLI is defined as follows:
$$
{\rm MLI} = \frac{F_1^{f_1} \times F_4^{f_4}}{F_2^{f_2} \times F_3^{f_3}}
$$
where $F_1$ is the number of disbursed containers, $F_2$ is the incentive for returning a bottle (e.g. the cash given for returning it), $F_3$ is the weight of the packaging material and $F_4$ is the material degradation over time (400 years in the case of glass, 100 years for PET). The values $f_1, \ldots, f_4$ are weights used to capture the relative importance of each of the four inputs.
The results for various weightings are given in this table (taken from the paper but amended slightly for clarity). As with the graphs, a higher number is environmentally worse.
| MLI weights $f_1, \ldots, f_4$ | PET | R-PET | Non-returnable glass | Returnable glass |
|---|---|---|---|---|
| 3, 2, 1, 2 | 0.56 | 0.56 | 19.47 | 0.78 |
| 2, 2, 1, 1 | 5.56 | 5.56 | 21.16 | 0.85 |
| 1, 1, ½, 1 | 0.75 | 0.75 | 4.60 | 0.92 |
| 2, 2, ½, 1 | 1.24 | 1.24 | 21.16 | 0.85 |
| 2, 3, 1, 2 | 0.93 | 0.93 | 105.80 | 0.85 |
This table shows that independent of the weights applied, non-returnable glass has the highest environmental impact. However, the comparison between R-PET and returnable glass is more nuanced. The authors conclude the following:
“According to the MLI proposed, the best solution would be using returnable glass bottles, thanks to the low number of bottles needed and therefore dispersed, their weight and return incentives. However, it is important to remember that the environmental dispersion of bottle is strictly related to human’s behaviour: consequently, it is important to raise the consumers’ awareness on this topic.”
The paper is thorough and we’ve covered a lot of detail here, but the conclusion for me is much simpler: from an environmental perspective returnable PET plastic is clearly better than glass across multiple criteria. The only place where this doesn’t apply is for MLI, for which it’s much harder to make definitive judgements.
It seems therefore, that I should carry on choosing plastic packaging over glass whenever possible. That will benefit both my weight targets and the environment.
11 Oct 2020 : The danger of a non-transparent AI Register #
The cities of Helsinki and Amsterdam recently announced the launch of their local government AI Register (Helsinki) and Algorithm Register (Amsterdam). This is certainly forward-looking and with positive aims, but actually looking through the registers, I was surprised and a little perturbed by how vague the entries are.
If the purpose of the registers is to promote accountability then it concerns me that the current implementation only provides the veneer of transparency. If government is claiming to provide transparency when it's not, however well-intentioned, this can lead to more harm than good.
Here's the feedback I sent to the city administrations and to the company running the registers. I'm not really expecting any results, but writing out my concerns was extremely therapeutic, albeit also quite time consuming. I recommend it as a satisfying activity if you have the time to spare.
Comment
If the purpose of the registers is to promote accountability then it concerns me that the current implementation only provides the veneer of transparency. If government is claiming to provide transparency when it's not, however well-intentioned, this can lead to more harm than good.
Here's the feedback I sent to the city administrations and to the company running the registers. I'm not really expecting any results, but writing out my concerns was extremely therapeutic, albeit also quite time consuming. I recommend it as a satisfying activity if you have the time to spare.
With the recent establishment of your AI/algorithm registers, it’s great that you're taking the transparency of automated processes seriously. I hesitate therefore to criticise the schemes which are clearly well-intentioned and a step in the right direction, but it concerns me — based on the data currently available in the registers — that in their current form they may do more harm than good.
My three main concerns are the following.
1. Confusion between AI and algorithms. These two things are not the same, and conflating the two degrades public understanding of the issues involved. Algorithms cover a very broad set of concepts that includes every piece of software in use today. AI (or more specifically Machine Learning) is a much narrower concept. Machine learning involves applying an algorithm to a dataset, in order to produce a separate algorithm that can then be used as the basis for decision-making (or some other task). The resulting algorithms are much more opaque, their biases much harder to understand, and the datasets much more important for providing that understanding. Right now the register seems to include a mixture of both machine learning and traditional algorithms, but without any clarity over which is which. For each of the entries it should be made clear whether machine learning is involved, and if so what type.
2. Providing the algorithms. The entries in the database provide only a very high-level overview of the algorithms being used. Frankly, these are of no real use without more detail and the code for the algorithms needs to be made available. I’m very aware that commercial sensitivity is often used as an argument for why this can't be done, but as someone who works for a company developing open source software, I’m also aware that keeping algorithms and datasets private isn’t the only way to run a commercial or public service. If the register is to have real benefit, Helsinki and Amsterdam cities need to apply pressure to companies to make their algorithms available, or else give preference to those companies that will. Otherwise the register will end up being no more than a list of names of companies supplying software to local government.
3. Providing the datasets. If the algorithms are machine learning algorithms, then the full datasets used for training need to be made available (or a recent snapshot in the case of dynamic learning). Consideration must be given to privacy, and this is a real challenge, but the good news is that there’s a wealth of existing good practice in this area, especially coming from universities with their growing culture of open data for validating research, supported and encouraged by EU funding requirements.
To reiterate, I applaud the idea behind the registers, but I’d also encourage you to go further in order to allow them to be the real tools of accountability that the public needs, and that I think you're aiming for.
I was pleased to complete the survey on your site, where I also entered these comments. When you reply please let me know if you prefer me not to make our correspondence public (I’ll assume that it’s okay for me to do so unless you state otherwise).
Thanks for your efforts with the registers, which I wish you every success with, and for taking the time to read this message.


